MOF data shows top 20 per cent of resident households averaged S$5.3 million in net wealth in 2023
Singapore’s wealthiest 20 per cent of resident households averaged S$5.3 million in net wealth in 2023, largely from property assets, according to the first comprehensive household wealth data released by the Ministry of Finance.

- The top 20 per cent of resident households held average net wealth of S$5.3 million in 2023.
- Overall household wealth is positive across all income quintiles, with home equity and CPF balances as the largest components.
- MOF data claims Income inequality has declined over the past decade, even as wealth inequality remains higher than income inequality.

SINGAPORE: The wealthiest 20 per cent of resident households in Singapore held an average net wealth of S$5.3 million in 2023, according to the first comprehensive household wealth data released by the Ministry of Finance on 9 February 2026.
Property assets accounted for the largest share of this wealth, averaging S$3.4 million per household in the top quintile, the ministry said in an occasional paper on income growth, inequality and social mobility trends.
MOF defines net wealth as total assets minus total liabilities. Assets include property values, net Central Provident Fund balances and other financial assets such as savings and dividends.
Liabilities consist mainly of outstanding mortgages and other debts.
According to the ministry, this framework provides a clearer and more comprehensive picture of household balance sheets across income groups.

Expanded survey underpins new wealth estimates
The wealth figures were released alongside MOF’s regular household income data report.
They were calculated by the Singapore Department of Statistics using data from the 2023 Household Expenditure Survey, supplemented with administrative data where available.
The five-yearly survey has been progressively expanded to improve the quality of wealth data.
Enhancements in the 2023 survey enabled SingStat to estimate non-owner-occupied home equity for the first time.
This form of equity represents a significant source of wealth, particularly for higher-income households with investment properties, MOF noted.
Home equity dominates household balance sheets
The survey found that most resident households across all income groups held positive net wealth.
Across all quintiles, home equity and CPF balances were the largest asset components.
Liabilities across the distribution consisted mainly of outstanding mortgages, reflecting Singapore’s high rate of home ownership.
Home equity, defined as property value less outstanding mortgages, made up more than half of average household wealth across all quintiles.
This ranged from 54 per cent for the bottom 20 per cent to 58 per cent for the top 20 per cent.
CPF balances constituted about 22 per cent of household wealth overall.
The share was higher among lower-income households, accounting for 39 per cent of wealth in the bottom quintile and 15 per cent in the top quintile.
As the CPF is a defined contribution pension system, balances can be directly attributed to individuals and captured in household wealth estimates, MOF said.

Financial assets vary sharply by income level
Other financial assets, including savings and investment income such as dividends, made up the remaining 22 per cent of household wealth on average.
This ranged from 7 per cent for the bottom quintile to 27 per cent for the top quintile.
In absolute terms, households in the 61st to 80th percentile held average net wealth of S$1.6 million.
Those in the middle 20 per cent averaged S$994,000, while households in the 21st to 40th percentile held S$666,000.
Households in the bottom 20 per cent held positive net wealth of S$293,000 on average, largely driven by home equity, MOF said.
International comparison highlights Singapore’s home ownership effect
The ministry contrasted this with conditions in other advanced economies.
In the United Kingdom and Australia, households in the bottom quintile have zero or negative home equity on average.
Among the top 20 per cent of households in Singapore, property assets accounted for the bulk of wealth. Other financial assets averaged S$1.4 million, while net CPF balances stood at S$771,000.
Total liabilities in the top quintile averaged S$331,000, with mortgages accounting for S$317,000.
In contrast, households in the bottom quintile held average property assets of S$221,000, net CPF balances of S$114,000 and other financial assets of S$29,000.
Their total liabilities averaged S$71,000, comprising S$64,000 in mortgages and S$8,000 in other liabilities.
Wealth inequality higher than income inequality
Across all resident households, average net wealth stood at S$1.76 million in 2023.
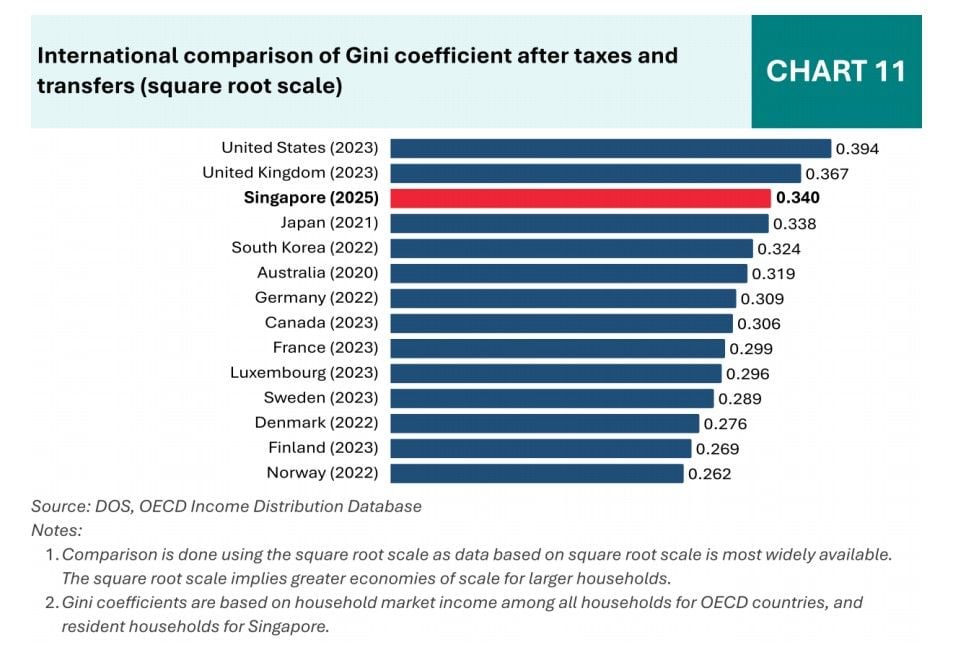
Singapore’s wealth Gini coefficient was estimated at 0.55, higher than the income Gini coefficient of 0.379 after taxes and transfers, based on household market income.
MOF said this is consistent with international experience, as wealth inequality tends to exceed income inequality.
Based on available data, Singapore’s wealth Gini coefficient is broadly comparable to that of other advanced economies, including the United Kingdom, Japan and Germany, where estimates range from 0.6 to 0.7.
Data limitations and under-reporting risks
The ministry cautioned that wealth data may be affected by under-reporting.
Some respondents may have chosen not to disclose sensitive financial information or had difficulty recalling details.
If under-reporting is more prevalent among wealthier households, wealth at the top of the distribution is likely underestimated, MOF said.
Globally, assets such as equity in private companies and overseas holdings are difficult to track and value, while financial confidentiality provisions further constrain data collection.
Nevertheless, the government said it will continue refining its wealth estimates.
Income inequality continues to ease
The occasional paper also reported continued improvements in income inequality.
The Gini coefficient after taxes and transfers, based on household employment income, declined to 0.359 in 2025 from 0.409 in 2015.
The Gini coefficient based on household market income also improved, falling to 0.379 in 2025 from 0.437 in 2015.
MOF said income growth has been broad-based, with households across all deciles experiencing real income growth over the past decade. Lower-income households recorded higher real income growth.
Social mobility and policy response
Most Singaporeans have experienced upward income mobility across generations, and Singapore has sustained social mobility relatively well compared with other advanced economies, MOF said.
Prime Minister Lawrence Wong, responding in a social media video, said early signs of slowing social mobility have begun to emerge as the economy matures.
“The data tells us that our policies have worked well over the past decade. But amid new headwinds, keeping Singapore moving in the right direction will require more effort and a willingness to adapt and do things differently,” he said.
He added that the findings underscore the need for policies under the Forward Singapore initiative, aimed at renewing the social compact.
“In this term of government, we will press on with our efforts to build a fairer and more just society, and a more inclusive Singapore for all,” he said.
The occasional paper updates an earlier study published in August 2015, which examined income growth, inequality and mobility trends based on household employment income.